Piece Written By Nkosilathi Dube, Trive Financial Market Analyst
Starbucks Corporation (ISIN: US8552441094) recently unveiled its third-quarter earnings report, a mixed bag of results that left Wall Street analysts intrigued and cautious. Earnings per share stood at a robust $1.00, exceeding expectations by a solid 5%. However, revenue figures, totalling $9.17 billion, fell slightly short of forecasts by $121.16 million.
Despite the revenue miss, the report contained a blend of positive news. Sales in the U.S. and international segments demonstrated significant year-on-year growth, with China emerging as a standout performer for the company’s third quarter. Starbucks continued its global expansion, unveiling 588 new stores and crossing the impressive threshold of 37,000 stores worldwide.
These upbeat sales figures cascaded through the company’s income statement, resulting in an improved bottom line compared to the previous year. However, Starbucks’ share price surprisingly remained somewhat subdued, trading nearly 5% below its post-earnings results. This raises a pivotal question: what factors have triggered this unexpected decline in share price despite the positive quarterly performance?
Technical
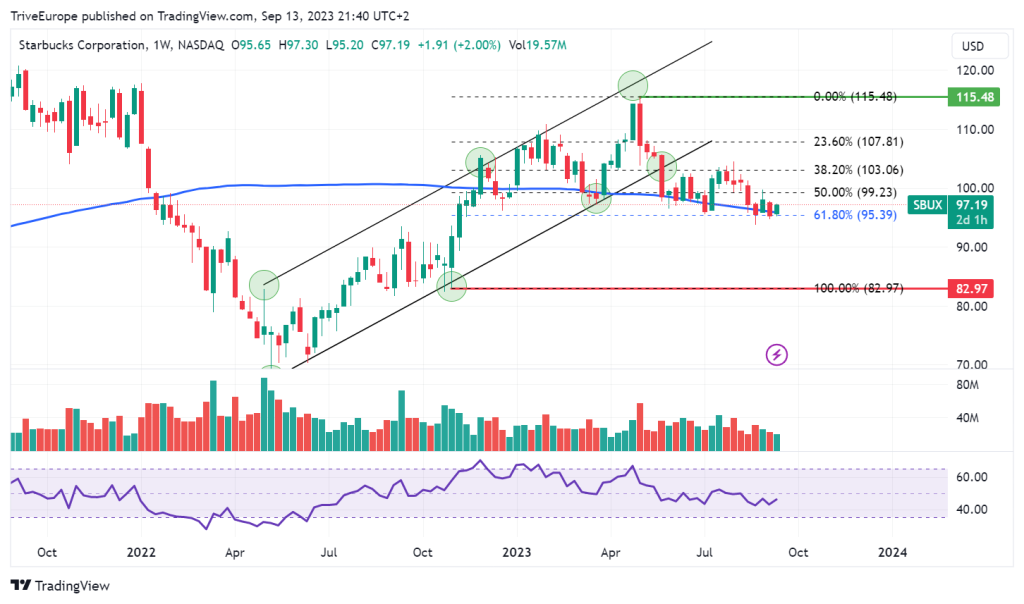
Starbucks’ share price has been on a rollercoaster ride, reflecting the ebb and flow of market sentiment and technical factors. After a challenging 2022 that saw the stock plummet by 15.19%, 2023 hasn’t brought much relief, with a year-to-date decline of 2.28%, despite a promising start that saw a 16% surge in the first half of the year.
The technical chart reveals interesting insights into the stock’s recent journey. In the third quarter of 2022, the share price found a foothold at $82.97 per share, serving as a crucial support level during a period of upward momentum. However, this surge hit a roadblock at $115.48 per share, leading to a sharp reversal and establishing a formidable resistance level.
Starbucks’ share price currently hovers around the 61.80% Fibonacci Retracement Golden Ratio, standing at $95.39 per share. This level has acted as an intermediate support in the stock’s journey. Optimistic investors will likely keep a close eye on the $115.48 per share resistance level, hoping for a momentum shift in their favour.
Conversely, a breakdown below the Golden Ratio, especially with high trading volume, may signal persistent downside pressures. In such a scenario, the $82.97 per share level from 2022 could become a significant point of interest for value-seeking investors looking to enter the market at a discounted price.

Fundamental
Starbucks Corporation showcased robust performance in the third quarter, posting impressive figures across various key metrics. Global comparable store sales saw a substantial uptick of 10%, a testament to the company’s strong market presence and customer loyalty. This surge was primarily underpinned by a commendable 5% rise in comparable transactions and a 4% boost in average ticket value.
Regionally, North America experienced a commendable 11% growth in revenue over Q3 to $6.7 billion. This growth was driven by a notable 7% increase in comparable store sales, a 6% surge in average ticket size, reflecting higher spending per visit, along with a 1% uptick in comparable transactions.
On the international front, net revenues grew 24% year-over-year. Starbucks continued to make significant strides, with a remarkable 24% rise in comparable store sales. This surge was fuelled by an impressive 21% increase in comparable transactions, highlighting the brand’s popularity and widespread appeal. Additionally, a 2% lift in average ticket value contributed to this stellar performance. Notably, China shined as the standout performer, with a staggering 46% surge in comparable store sales, driven by an astounding 48% rise in comparable transactions.

Source: Trive – Starbucks Corporation, Nkosilathi Dube
Furthermore, Starbucks’ global portfolio is strategically balanced, with stores in the U.S. and China comprising 61% of the company’s footprint. The U.S. boasts 16,144 stores, while China, a rapidly growing market, houses 6,480 stores, illustrating Starbucks’ successful expansion strategies in these key regions.
Financially, the company reported consolidated net revenues of $9.2 billion, an impressive 12% increase from the prior year. This revenue growth is indicative of strong consumer demand and effective pricing strategies. Additionally, the operating margin expanded to 17.3%, a substantial improvement from the prior year’s 15.9%. This growth was driven by higher sales leverage, pricing strategies, and productivity enhancements. However, it’s important to note that this expansion was partly offset by planned investments in labour and higher selling and administrative costs, aligning with the company’s Reinvention Plan.
Earnings per share also displayed remarkable growth, surging by 25% to reach $0.99. This figure reflects the company’s ability to effectively convert its revenue into profit, showcasing strong operational efficiency and financial management.
Finally, Starbucks’ Rewards loyalty program saw notable success, with 90-day active members in the U.S. soaring to 31.4 million, marking an impressive 15% year-over-year increase. This growth in loyalty program membership underscores the brand’s ability to foster lasting relationships with its customers.
Despite impressive earnings, Starbucks faces investor caution due to executives’ precautionary statements. Anticipated revenue pressure in Q4, driven by strong at-home coffee trends and an expected moderation in pricing trends after recent hikes, tempered immediate optimism.

Source: Trive – Koyfin, Nkosilathi Dube
Within the hotel, restaurants and leisure industry, Starbucks’ EBIT margin of 14.48% starkly contrasts its key competitors’ average of 26.92%. This discrepancy underscores a noteworthy difference in profitability efficiency. A lower EBIT margin could suggest that Starbucks may have higher operating costs or face competitive pricing pressures.

Source: Trive – Koyfin, Nkosilathi Dube
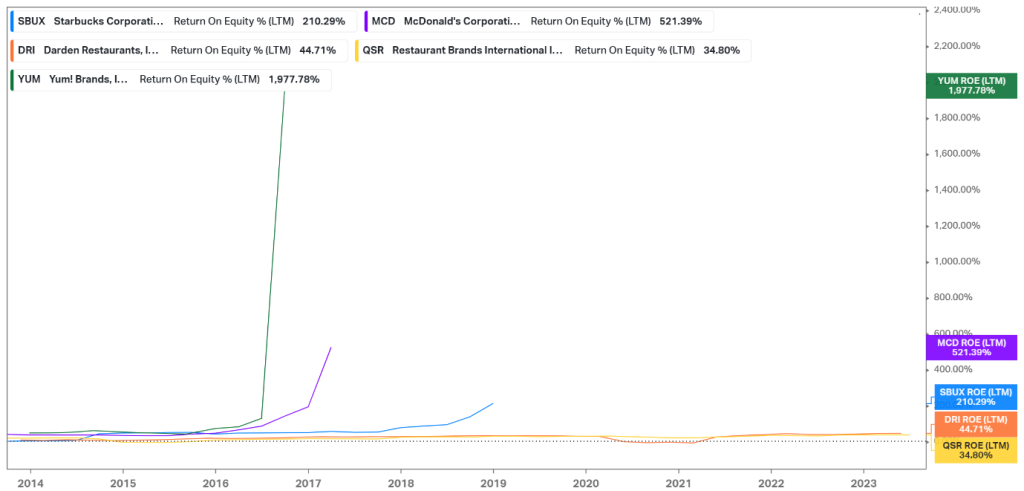
Over ten years, Starbucks boasts an impressive Return on Equity (ROE) of 210.29%, slightly surpassing the key competitors’ average of 202.80%, excluding Yum Brands Inc (ISIN: US9884981013). This signifies that for every dollar of shareholders’ equity invested, Starbucks generates higher profits than its peers on average. This strong performance reflects positively on Starbucks’ management and business strategies, underlining its capacity to deliver substantial returns and maintain investor confidence in a competitive market landscape. It’s an encouraging sign of financial health and potential for long-term growth.
After discounting for future cash flows, a fair value of $101.42 per share was derived.
Summary
Overall, Starbucks’ third-quarter performance is a testament to its strategic market positioning, effective operational management, and strong consumer appeal. The company’s ability to drive growth in both mature and emerging markets bodes well for its long-term sustainability and continued success in the highly competitive coffee industry.
Sources: Starbucks Corporation, Reuters, CNBC, TradingView, Koyfin

