Piece written by Tiaan van Aswegen, Trive Financial Market Analyst
As the market anticipated the Federal Reserve’s stance on future interest rates, the US CPI report showed mixed signals, resulting in the SPDR S&P 500 ETF (NYSE Arca: SPY) ending a volatile session relatively flat on Wednesday. While headline prices advanced more than consensus, the market received some respite in the core inflation figure, with US equities scrambling for direction on the new information.
Year-on-year inflation advanced from 3.2% to 3.7%, despite the consensus of 3.6%. However, core inflation showed a welcome decline from 4.7%, aligning with expectations at 4.3%, which firmly cemented the expectations for a pause at the Federal Reserve’s September meeting. For November, the core inflation figure moved expectations only slightly, with the CME FedWatch Tool now predicting a 56.8% probability of another pause, up from 53.1% a week ago.
The federal funds rate of 5.25% to 5.5% is currently at its highest level in 22 years, as policymakers have fought sticky inflation resulting from the Covid-19 aftermath. As a result, the US dollar has appreciated immensely to the detriment of the equity market. The graph below shows the greenback appreciation against a basket of major counterparts over the last three months, showing a clear uptrend.

Source: Trive – Koyfin, Tiaan van Aswegen
However, the US inflation rates have steadily decreased, as shown in the graph below. At 3.7%, it still remains well above the Federal Reserve’s 2% inflation target, leaving the door open for more hikes before the end of the year to sustainably achieve that target. If there is another hike in November, we could see further appreciation in the US dollar to the detriment of the equity market.
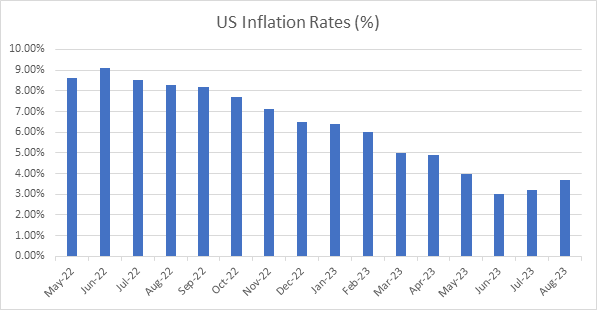
Source: Trive – Statista, Tiaan van Aswegen
Technical
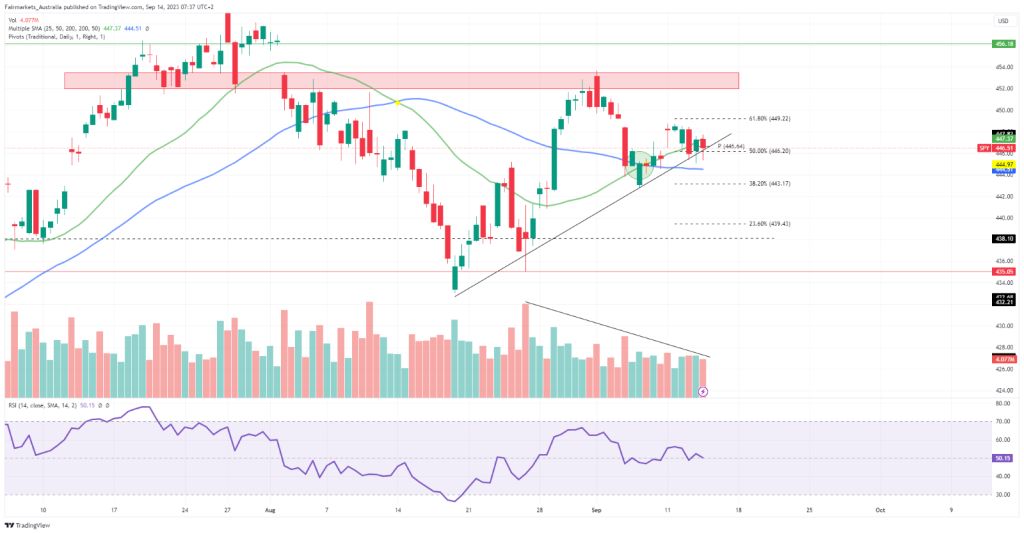
On the 4H chart, an uptrend has formed from the mid-August bottom, with the 25-SMA recently pushing above the 50-SMA, signalling bullish short-term momentum. However, the volumes of the uptrend have declined, and while currently below the daily pivot point of 446.64, there could be a pullback on the cards.
The pivot point is close to the Fibonacci midpoint at 446.20, and a breakdown at this level could bring the 50-SMA at 444.51 into account before reaching 443.17, the 38.2% Fibonacci retracement level. If support is found here, the price could retest the breakdown point at 446.20 in upcoming sessions.
However, if the uptrend holds, the price could test the 61.8% Fibonacci golden ratio again at 449.22 before facing a challenging supply zone at 453.46. If the upward momentum succeeds, the resistance at 456.18 could be within reach.
Summary
The mixed US CPI report has left equities relatively unchanged, making upcoming data releases pivotal in the direction of the equity market. If the uptrend support at the Fibonacci midpoint of 446.20 holds, the uptrend could continue toward 449.22.
Sources: Koyfin, Tradingview