The ProShares Ultra Oil & Gas ETF – DIG (ISIN: US74347G7051) tracks the performance of the Dow Jones U.S. Oil and Gas index. The index comprises companies primarily operating in the oil and gas sector, with the main activities including exploration and production, oil equipment and services, among others. The ETF comprises mainly large-cap stocks, with an investment style focused on value investing.
After leaping by a staggering 121.96% in 2022 due to surging energy prices (induced by supply-side constraints provoked by the Russia-Ukraine conflict), the DIG ETF is down 20% year-to-date as energy prices have returned to normalcy. Crude Oil Futures are down 10.40% year-to-date, while natural gas has plunged 44.14% in the same period. The weakness in energy prices has left energy sector stocks reeling after experiencing a fruitful 2022, with some of the giant energy corporations reporting record yearly profits. Is the upward trend on its last legs?
Technical
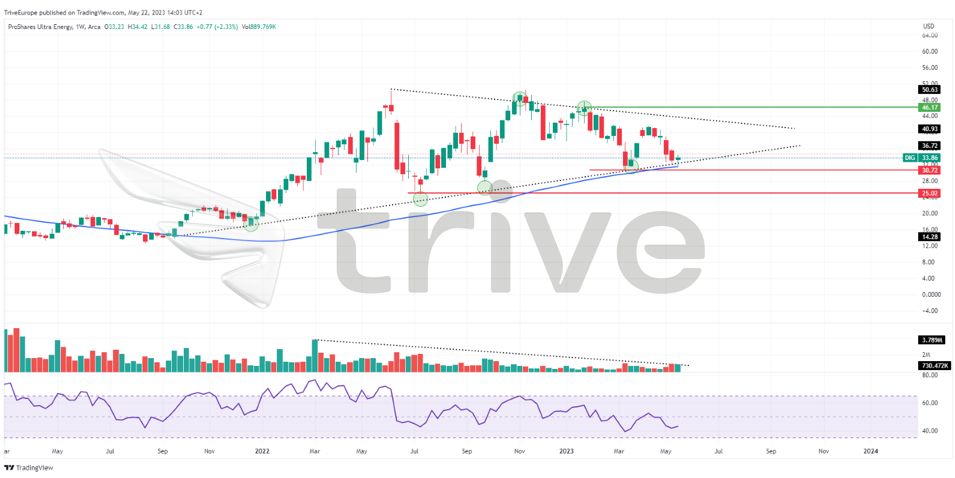
The DIG ETF has enjoyed upward momentum as peaking energy prices sent the ETF into an uptrend, with the price taking off from its 100-day moving average in 2022. However, the uptrend has stalled as the price has moved lower, coming within reach of its 100-day moving average. Combined with weakening volumes, the range between the price action highs and lows has narrowed and formed a symmetric triangle. Support and resistance were established at the $30.72 and $46.17 levels, respectively.
Given that the ETF is consolidating, bulls and bears are in contention to take the ETF in one direction, with one side potentially losing out at the conclusion of the consolidation. A reversal is probable, with the Relative Strength Index pointing to oversold levels and price trading at the symmetric triangle’s support. Bullish traders will likely aim for resistance at the $46.17 level if they commit to the upside in numbers outweighing bears.
Alternatively, a high volume breakdown below the symmetric triangle and support level could indicate that bearish traders have the upper hand. If the DIG ETF is lowered, Bulls could look to the $25.02 level, which forms the next immediate support level, for long opportunities. Long opportunities could be validated by declining volumes to the downside as the price approaches the $25.02 level.
Fundamental
With energy prices declining, energy companies’ top and bottom lines will likely be weighed down, potentially keeping the DIG ETF under pressure. The U.S. economy has shown signs of moderation, with manufacturing (a critical consumer of oil and gas) contracting. As of May 2023, U.S. manufacturing and freight activity has been on the downturn for six consecutive months, with consumption of diesel and other fuels taking the same route downward.
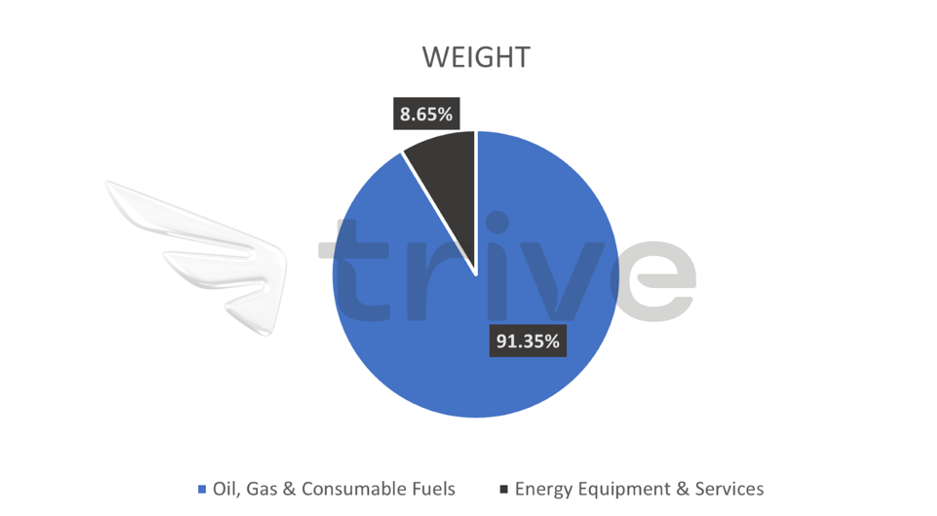
The DIG ETF is mainly concentrated in the Oil, Gas and Consumable Fuels sector, comprising 91.35% of the entire ETF. In comparison, Energy Equipment and Services comprise only 8.65% of the total holdings. The ETF is fully exposed to U.S. energy stocks; therefore, its performance relies deeply on the fundamental conditions of the U.S. economy and stock market.
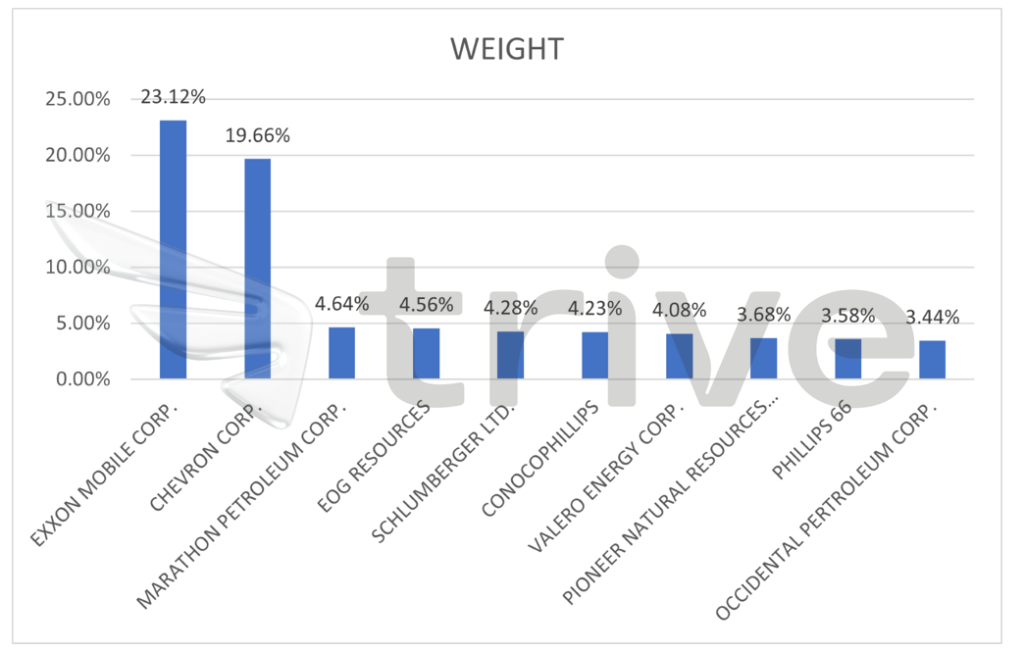
Of the entire index, the ETF is heavily exposed to two U.S. Oil Giants, which comprise 42% of the entire holding, Exxon Mobil Corp (ISIN: US30231G1022) and Chevron Corporation (ISIN: US1667641005). The remainder of the holdings within the ETF make up less than 5% each, while the top ten comprise just over 75% of the entire holding.
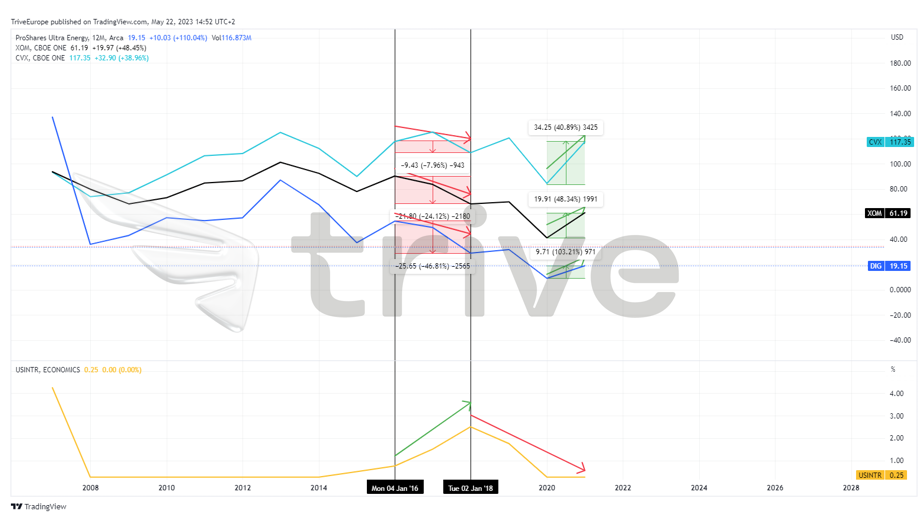
The illustration below compares the DIG ETF’s performance to Exxon Mobil, Chevron, and U.S. Interest rates. There is a strong positive correlation between the ETF and its larger holdings as they tend to move in similar directions simultaneously.
The DIG ETF is also sensitive to interest rate changes throughout economic cycles. During the 2016 to 2018 period, U.S. interest rates surged as the Federal Reserve tightened its policy. The DIG ETF and its top two holdings declined significantly in value as a result. The DIG ETF shed 46.81% over the period, while Exxon Mobil and Chevron Corp shed 24.12% and 7.96%, respectively. Higher interest rates tend to slow economic growth and development, keeping energy demand subdued.
In contrast, the Covid-19 Pandemic Era saw interest rates decline significantly from their 2018 peak, leading to a 103.21%, 48.34% and 40.89% leap in the price of DIG, Exxon Mobil and Chevron Corp, respectively, after the lows induced by excess supply formed in 2020.
Summary
If the U.S. economy avoids a recession while lowering interest rates, economic activity could pick up steam to support energy and energy stock prices. Given that interest rates are seemingly at a peak, with the majority of the market waging a pause in the upcoming Federal Reserve interest rate decision, the DIG ETF’s downside could find its floor as the economy opens the door to growth in the medium to long term, leaving the $46.17 level probable.
Sources: Proshares, Refinitiv, Financial Times, Reuters, CME Fedwatch Tool, TradingView