Piece written by Alexa Smith, Trive Financial Market Analyst
The United States Oil Fund (NYSEARCA: USO) tumbled due to the ascendancy of the US dollar, the upward trajectory of US bond yields, and a convoluted array of signals pertaining to supply. The Greenback reached an 11-month high due to favourable economic data and the avoidance of a partial government shutdown, which kindled expectations that the Federal Reserve would maintain higher interest rates.
The combination of elevated interest rates and a resilient US Dollar renders oil more expensive for holders of other currencies, potentially eliciting a decline in oil demand. Oil supply is also taking strain from high interest rates, posing the risk of exorbitant inventory storage costs, which, in turn, could catalyse further destocking of oil inventories.
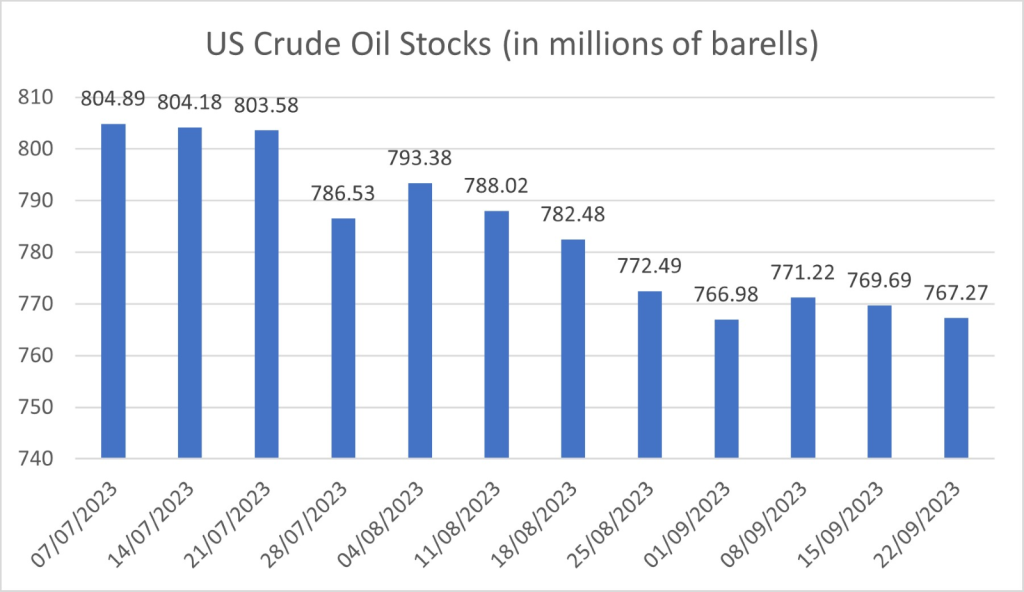
From the below graph, Crude Oil Stocks have reached their lowest level in more than a year, which could further strain supply. With the API Crude Oil Stock Change expected later today, demand sentiment may hope for a rise from the week prior as supply dynamics take centre stage.
Moreover, the OPEC+ are anticipated to maintain their existing output settings during their forthcoming meeting on Wednesday, thereby perpetuating tight supply. In light of the decelerating global economy, the group would seek to uphold its prevailing production cuts while signalling a readiness to institute further reductions should market dynamics necessitate such measures.
Técnicos
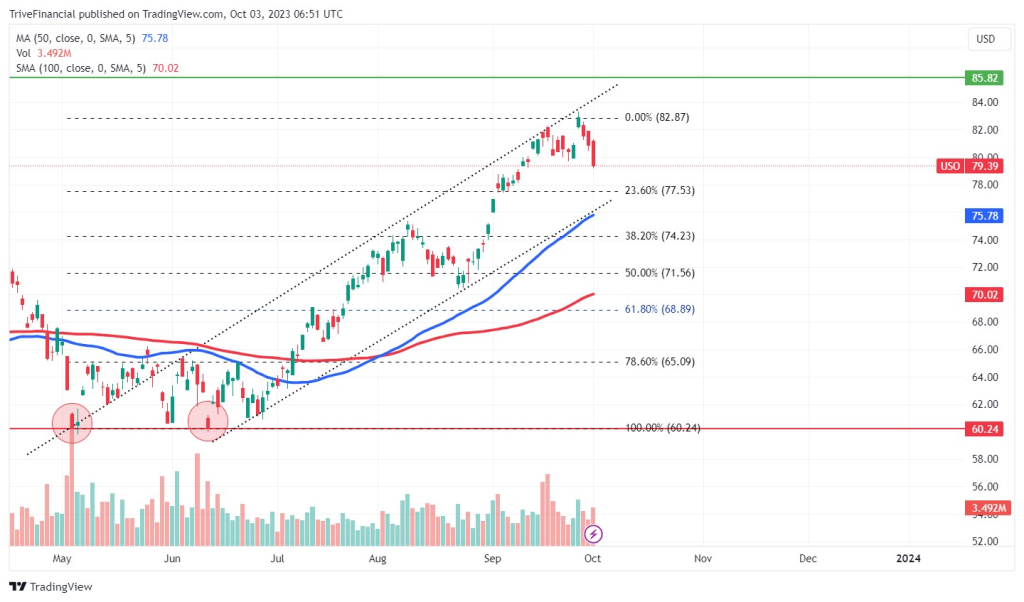
The United States Oil Fund slipped from the 15-month peak of $82.87 but still finds itself within an ascending channel pattern. With tighter supply and raised prices, the ETF may retest the $77.53 support at the 23.60% Fibonacci Retracement, which coincides with the 50-day moving average line and the channel’s lower boundary.
If a breakdown of the $77.53 support occurs, a further pullback may set its sights on the $74.23 support, which could mark a pivot point for a reversal. However, buying volume is still overshadowing selling volume, which could see the ETF retest the $82.87 resistance after cushioning at the channel’s lower boundary. This intersection could see the broader uptrend play out.
Resumen
An ascending channel pattern is still evident on the 1D Chart as demand continues to take centre stage, which could see the United States Oil Fund retest the $82.87 resistance. However, tight supply and a strengthening Greenback may begin to strain the ETF’s gains and promote a further pullback towards the $77.53 support.
Sources: TradingView, Reuters, YCharts