Piece Written By Nkosilathi Dube, Trive Financial Market Analyst
Berkshire Hathaway Inc’s (ISIN: US0846707026) second-quarter performance for 2023 commanded attention, with earnings per share soaring to $4.62, a remarkable 24.29% surge beyond expectations, and revenues reaching $92.50 billion, exceeding estimates by 12.64%. This triumph stirred enthusiasm among investors, propelling the stock price skyward by 3.60%.
Amidst this surge lies a compelling year-to-date share price increase of 17.38%, hinting at the company’s potential to maintain a remarkable eighth consecutive year of positive performance. Standing tall among the global financial giants, Berkshire Hathaway’s strategic prowess is illuminated by its investments in equity securities, which have surged by 14.45% since December 2022, now totalling a substantial $353.41 million.
While the company celebrates its robust top-line growth, a juxtaposition emerges in the world of derivatives and investments. Though substantial, this quarter’s gains pale compared to the preceding year, where challenges were met with losses. The climax of this turnaround narrative is the remarkable shift from a staggering $43.62 billion loss in the same quarter a year ago to a resounding profit.
Technische Analyse
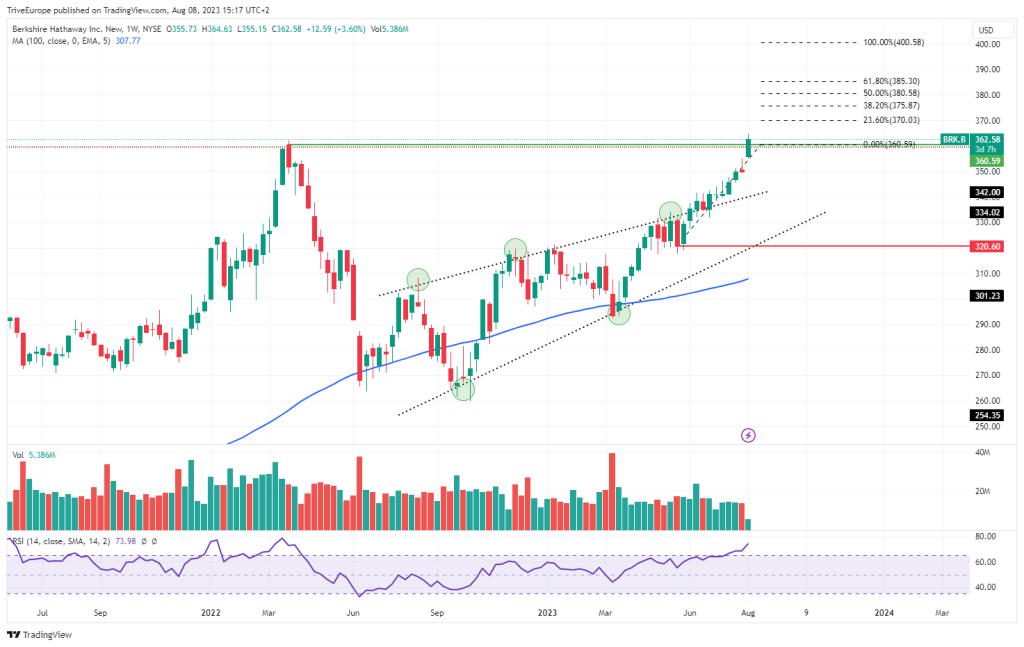
Berkshire Hathaway has orchestrated an impressive performance, gaining nearly a fifth in market value year-to-date, a testament to its prowess in captivating market sentiment. The stock’s trajectory has painted a compelling picture, echoing the positive earnings results that have instigated market enthusiasm. Firmly entrenched in an upward trend, the share price has distanced itself from its 100-day moving average, exemplifying the strength of its ascent.
Emerging from a sharp downturn in Q2 2022, the share price traced a rising wedge pattern, culminating in a high-volume breakout from the $320.60 per share level. This level now stands as support, anchoring the stock’s current trajectory. Recent developments saw a breakthrough of the March 2022 resistance at $360.59 per share, a milestone that could propel the stock’s upward momentum as investors rally.
The potential ascent to the $385.30 per share mark, earmarked by the 61.80% Golden Ratio of the Fibonacci Extension, presents a focal point of interest to the upside. In contrast, a reversal could be likely as the share price flirts with an all-time high and encounters overbought conditions in the Relative Strength Index. Optimistic investors should be wary of a reversal which could push the stock into a discount.
Source: Trive – Berkshire Hathaway Inc, TradingView Nkosilathi Dube
Fundamentalanalyse
Berkshire Hathaway’s recent quarterly performance stands as a vivid testament to its strategic prowess as it navigates the economic currents with remarkable finesse.
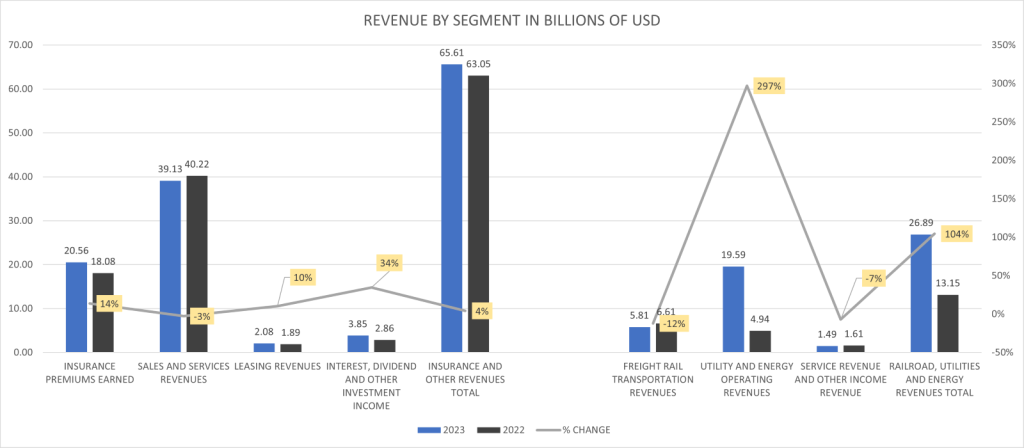
Within the diversified strengths of Berkshire Hathaway, both the Insurance & Other Segment and the Railroad, Utilities & Energy Segment recorded revenue expansion. The Insurance & Other Segment witnessed a 4% uptick in revenue, accompanied by a remarkable 104% surge in the Railroad, Utilities & Energy Segment. This second segment, however, takes centre stage, after more than doubling its revenue, propelled by an astonishing 297% escalation in Utility and energy operating revenues to a commanding $19.59 billion.
Source: Trive – Berkshire Hathaway Inc, Nkosilathi Dube
The Insurance & Other Segment’s main driving forces were Insurance Premiums and Interest, Dividend & other investments. These segments grew by 14% to $20.56 billion and 34% to $3.85 billion, respectively.
The upbeat financials continued to build, with operating earnings reaching $10.04 billion, representing a 6.6% escalation from the same quarter a year prior. A triumphant net income of $36.20 billion paled in comparison to a $43.24 billion loss that painted last year’s second quarter.
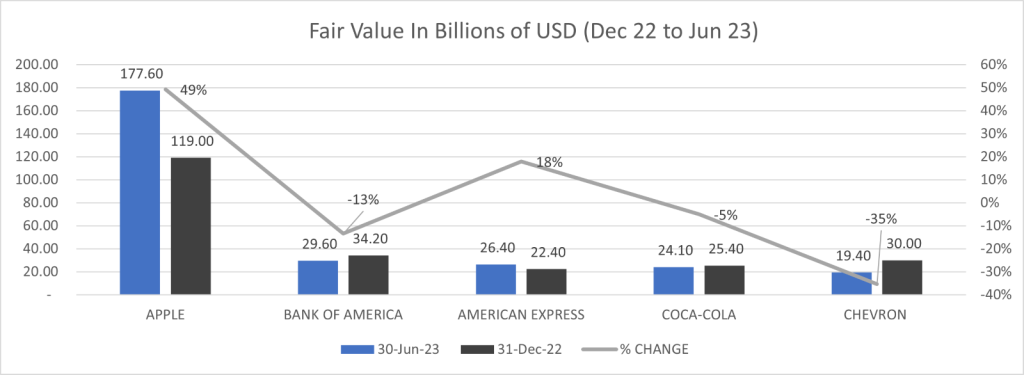
Berkshire Hathaway’s concentrated holdings continue to evolve, with around 78% of the fair value now concentrated in just five companies. Apple Inc (ISIN: US0378331005) takes the lead with $177.6 billion held, experiencing a remarkable 49% fair value gain from the end of 2022 to June 2023, exemplifying the power of a strong performer in a diversified portfolio. American Express also shines, boasting an 18% year-to-date gain as of June 2023.
Source: Trive – Berkshire Hathaway Inc, Nkosilathi Dube
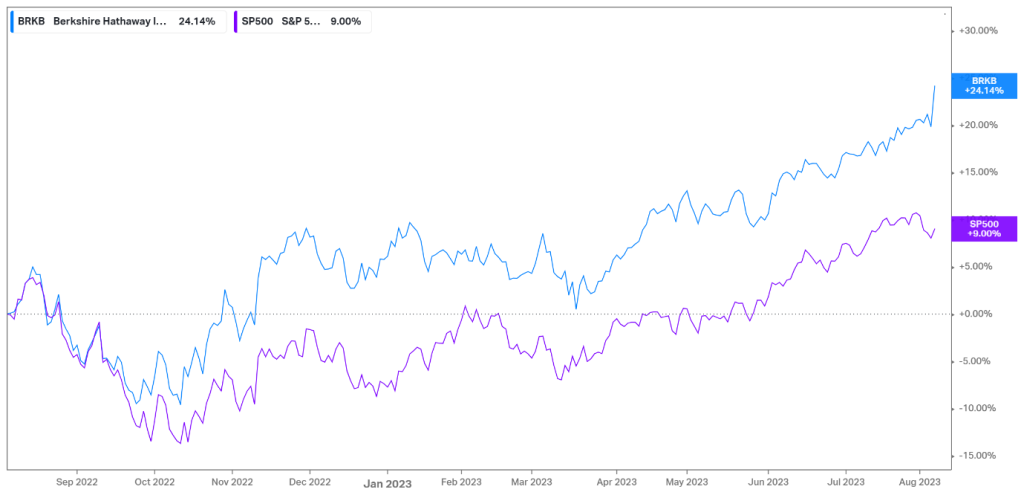
Berkshire Hathaway’s stock has showcased exceptional resilience, eclipsing the S&P 500’s performance by almost double since October 2022’s low formed. Despite their positive correlation, the market’s attraction to Berkshire Hathaway is underscored by robust earnings and returns since the market’s turnaround. This phenomenon underscores the influence of solid fundamentals on stock valuation and investor sentiment.
Source: Trive – Koyfin, Nkosilathi Dube
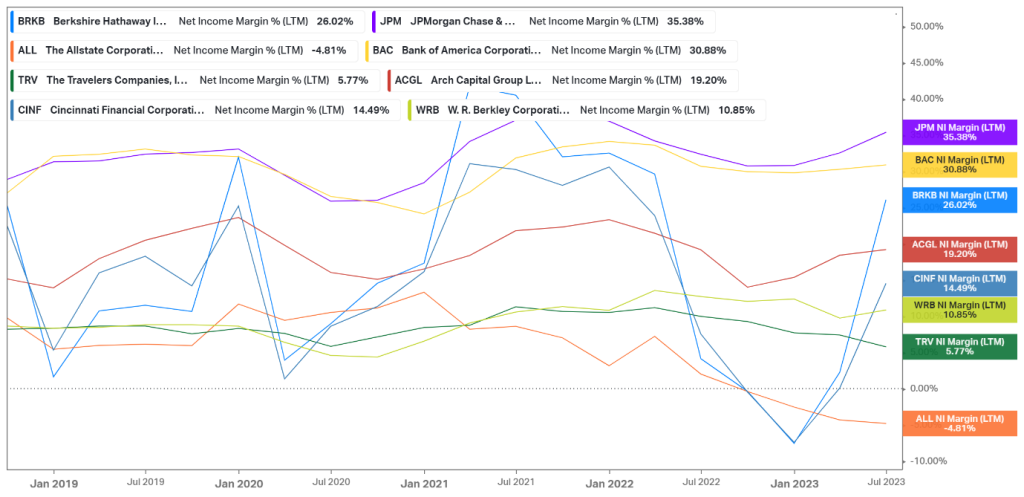
Berkshire Hathaway distinguishes itself among competitors with robust profitability, second only to major U.S. banks. Its 26.02% profitability offers investors solid returns, yet its susceptibility to market volatility highlights the delicate interplay between company performance and broader economic forces.
Source: Trive – Koyfin, Nkosilathi Dube
After discounting for future cash flows, a fair value of $373.00 per share was derived.
Zusammenfassung
Berkshire Hathaway’s Q2 2023 performance showcased impressive earnings and revenue growth, driving its stock price up by 3.60% post-earnings. With a year-to-date increase of 17.38%, the company’s strategic investments in equity securities stand out. The technical analysis highlights an upward trend, while fundamental strengths are evident in revenue expansion across segments. Concentrated holdings in key companies like Apple underscore the power of diversification. The fair value of $373.00 per share could materialise in the medium to long term if upbeat performance extends into future quarters.
Sources: Berkshire Hathaway Inc., CNBC, Reuters, Market Insider, Sovereign Wealth Fund Institute, TradingView, Koyfin
This material is provided for informational purposes only and does not constitute financial, investment or other advice. No opinion contained in this material constitutes a recommendation by Trive Financial Services Malta Limited or its author as to any particular investment, transaction or investment strategy and should not be relied upon in making any investment decision. In particular, the information does not take into account the individual investment objectives or financial circumstances of the individual investor. Trive Financial Services Malta Limited shall not be liable for any loss, damage or injury arising from the use of this information.