Piece Written by Mfanafuthi Mhlongo, Trive Financial Market Analyst
In the ever-evolving world of financial markets, traders and investors are constantly on the lookout for tools and strategies that can help them make informed decisions. One such tool that has gained popularity over the years is the Ichimoku Cloud. Developed by Japanese journalist Goichi Hosoda in the late 1960s, the Ichimoku Cloud is a versatile technical analysis indicator that provides valuable insights into market trends, support and resistance levels, and potential reversal points. Fair warning, that just because it proved useful to them in the past, it doesn’t mean that effect can be replicated.
In this article, we will delve into the principles behind the Ichimoku Cloud, its components, and how it can be effectively used in financial markets, with a focus on its relevance to market sentiment theories.
Understanding the Ichimoku Cloud
At its core, the Ichimoku Cloud is a comprehensive indicator that offers a holistic view of price action and market sentiment. It comprises five key components:
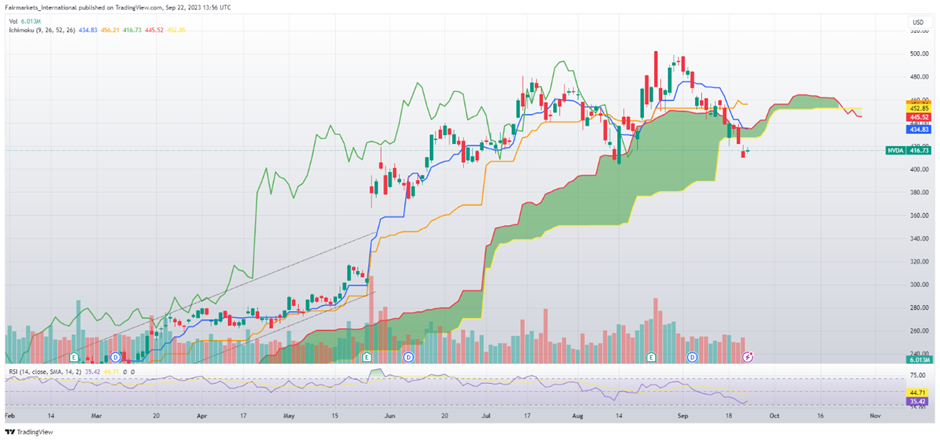
- Tenkan-sen (Conversion Line) (blue line): This is the shorter-term moving average calculated by averaging the highest high and lowest low over a specified period, typically 9 periods. It provides insight into short-term price momentum.
- Kijun-sen (Base Line) (orange line): The Kijun-sen is a longer-term moving average calculated over 26 periods. It helps identify medium-term trends and acts as a support or resistance level.
- Senkou Span A (Leading Span A) (red line): This is the midpoint between the Tenkan-sen and Kijun-sen, plotted 26 periods ahead of the current price, based on historical data. It forms the upper boundary of the cloud and could provide an indication of potential future support and resistance levels.
- Senkou Span B (Leading Span B) (green line): Like Senkou Span A, this component is plotted 52 periods ahead of the current price based on historical data and forms the lower boundary of the cloud. It also serves as an indication of potential support and resistance levels.
- Chikou Span (Lagging Span) (yellow line): This is the closing price plotted 26 periods behind the current price.
- Kumo (Cloud): The Kumo is the area between Senkou Span A and Senkou Span B. It helps traders identify potential trend changes as it represents the current and probable future equilibrium based on historical data that won’t necessarily correlate to actual performance in the market.
Using the Ichimoku Cloud in Financial Markets
The Ichimoku Cloud can be a powerful tool for traders and investors across various financial markets, including stocks, forex, and commodities. Here’s how it can be applied:
- Trend Identification: By observing the relative positions of the Tenkan-sen and Kijun-sen, traders can determine the direction of the prevailing trend. When the Tenkan-sen is above the Kijun-sen, it suggests a bullish trend, while the opposite indicates a bearish trend.
- Support and Resistance: Senkou Span A and Senkou Span B, along with the Kumo, provide dynamic support and resistance levels. Breakouts above or below these levels can signal potential trend reversals.
- Cloud Twist: The twist of the Kumo, where Senkou Span A crosses above or below Senkou Span B, can be a strong signal for trend changes. A bullish twist occurs when Senkou Span A crosses above B, indicating a potential uptrend, and vice versa for a bearish twist.
- Trading Signals: Entry and exit signals can be generated when price action interacts with the cloud. For instance, when the price crosses above the cloud, it could signal a long (buy) position, while a cross below the cloud would imply a short (sell) position.
Market Sentiment and the Ichimoku Cloud
Market sentiment plays a crucial role in price movements, and the Ichimoku Cloud can be a valuable tool for assessing sentiment. Here’s how:
- Bullish and Bearish Clouds: A thick, bullish cloud (Kumo) indicates strong support and suggests a bullish sentiment, while a thick, bearish cloud suggests the opposite. Traders can use this information to align their trades with prevailing sentiment.
- Chikou Span Confirmation: The Chikou Span, which represents the current closing price plotted 26 periods back, can confirm sentiment. When it’s above the cloud, it validates a bullish sentiment, and vice versa.
Let’s consider a practical example of how the Ichimoku Cloud can be used in the forex market:
Suppose the Tenkan-sen crosses above the Kijun-sen, indicating a bullish trend. Simultaneously, the Chikou Span is above the cloud, confirming the bullish sentiment. Additionally, the price has recently crossed above the cloud. These signals collectively suggest a strong bullish bias.
However, one must always remember that this information is based on past performance, and that it is not predictive of the future in an accurate way. Just because it indicates bullish behaviour, it doesn’t mean the market won’t do the complete opposite.
Conclusion
The Ichimoku Cloud is a versatile technical analysis tool that provides a comprehensive view of price action and market sentiment. By understanding its components and principles, traders and investors can make more informed decisions in financial markets.
Whether you’re looking to identify trends, support and resistance levels, or assess market sentiment, the Ichimoku Cloud is a valuable addition to your trading toolbox, enhancing your ability to navigate the complex world of finance with confidence and equipped with more information.
Quellen: TradingView, Reuters, Investopedia, Wall Street Mojo, Corporate Finance Institute, Academia.
This material is provided for informational purposes only and does not constitute financial, investment or other advice. No opinion contained in this material constitutes a recommendation by Trive Financial Services Malta Limited or its author as to any particular investment, transaction or investment strategy and should not be relied upon in making any investment decision. In particular, the information does not take into account the individual investment objectives or financial circumstances of the individual investor. Trive Financial Services Malta Limited shall not be liable for any loss, damage or injury arising from the use of this information. CFDs are complex instruments and come with a high risk of losing money rapidly due to leverage. 73% of retail investor accounts lose money when trading CFDs with Trive Financial Services Malta Limited. You should consider whether you understand how CFDs work and whether you can afford to take the high risk of losing your money.