Piece written by Alexa Smith, Trive Financial Market Analyst
The United States Oil Fund (NYSEARCA: USO) is on the crux of a 14-month high due to constrained supply following a substantial drawdown in US inventories. Last week, Saudi Arabia extended its one million barrel per day (bpd) production cut until year-end, diverging from its earlier plan of winding down production cuts after the current month. Simultaneously, Russia disclosed its intention to curtail output by 300000 bpd for the remainder of the year.
The paucity in supply has begun to erode inventory levels, as evidenced by the report from the Energy Information Administration on Thursday, revealing a decrease of 6.3 million barrels in US oil stocks during the past week and marking the seventh drawdown in eight weeks. This reduction vastly exceeded the consensus estimate, which predicted a drawdown of 1.43 million barrels.
The EIA Crude Oil storage of 416.6 million barrels is within striking distance of the 17-month low of 413.9 million barrels recorded during the week of December 2, 2022. Disregarding the production cuts from Saudi Arabia and Russia, the low storage in the US has the potential to spur demand. However, constrained supply raises the question of whether major oil producers can service rising interest.
Technische Analyse
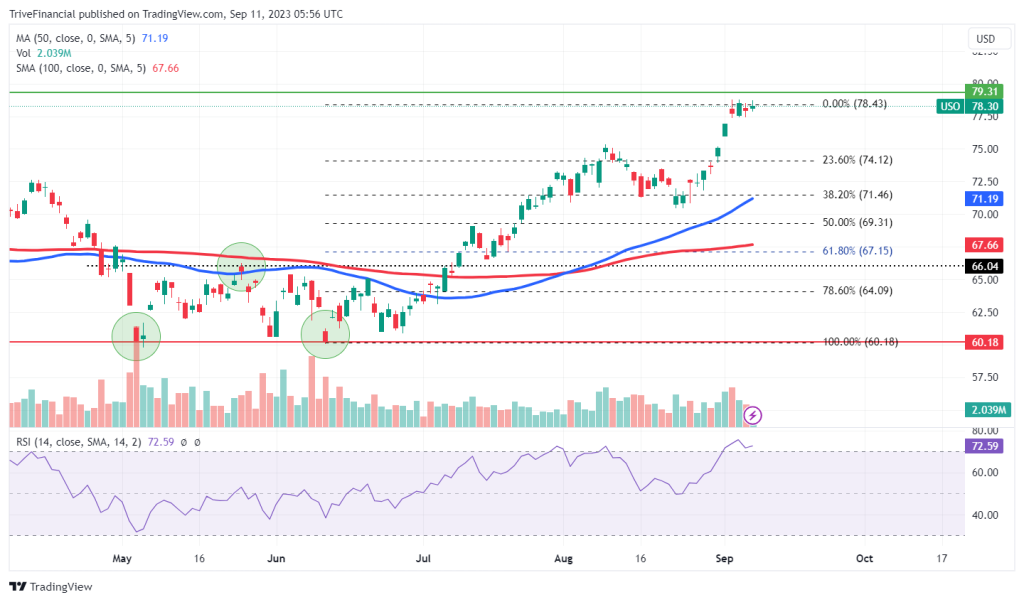
A rectangle was evident on the 4H Chart as the United States Oil Fund lay bound by the $66.04 resistance and the $60.18 support. However, buying volume spurred the ETF to break out from the $66.04 resistance, marking a pivot point for an uptrend. Losses due to overbought levels capped at the $71.46 support, where divergence between the 50-day moving average and 100-day moving average bolstered the price action towards the $78.43 resistance.
Since the price action flattened at the $78.43 resistance, overbought levels could weigh the ETF down towards the $74.12 support, where a breakdown towards the $71.46 support could sustain a downtrend. However, the ETF may be encouraged to break down the $78.43 resistance, bolstering the price action towards the $79.31 major resistance, which denotes a 14-month high.

Zusammenfassung
The United States Oil Fund stands on the crux of a 14-month peak due to a drawdown in US inventories and further supply cuts from major oil producers, Saudi Arabia and Russia. If demand ticks up, the price action may be encouraged to retest the $79.31 major resistance. However, overbought levels could place the ETF under pressure, encouraging a potential pullback towards the $74.12 support.
Sources: TradingView, EIA
This material is provided for informational purposes only and does not constitute financial, investment or other advice. No opinion contained in this material constitutes a recommendation by Trive Financial Services Malta Limited or its author as to any particular investment, transaction or investment strategy and should not be relied upon in making any investment decision. In particular, the information does not take into account the individual investment objectives or financial circumstances of the individual investor. Trive Financial Services Malta Limited shall not be liable for any loss, damage or injury arising from the use of this information. CFDs are complex instruments and come with a high risk of losing money rapidly due to leverage. 73% of retail investor accounts lose money when trading CFDs with Trive Financial Services Malta Limited. You should consider whether you understand how CFDs work and whether you can afford to take the high risk of losing your money.


